
Paper LBO Example: Two Deals Solved Step by Step, With Both Debt Conventions, Interviewer Follow-Ups and a Practice Case
- LBO
- Private Equity

A paper LBO is a leveraged buyout you solve by hand, with no Excel, in a few minutes of an interview. This paper LBO example is solved end to end: a $450m buyout at 9x EBITDA that returns 2.875x and a 23.5% IRR over five years with bullet debt, the same deal with a cash sweep (2.94x, 24.0%), the follow-ups interviewers ask, and a second deal to solve on your own, where the right answer is “I'd pass.”
The interviewer slides a sheet of paper across the table: LTM EBITDA, a purchase multiple, a leverage level, a holding period. No Excel, often no calculator. You have a few minutes to say whether the fund should do the deal. That's a paper LBO, a common exercise in private equity interviews.
This page is a full paper LBO example, solved line by line, with every table written out in text and assumptions chosen so the numbers come out clean. Below the main walkthrough, you'll find the same deal under a second debt convention, the follow-up questions interviewers ask (including two reverse paper LBOs), an IRR table you can use without a calculator, the rule of 72 and where it breaks down, the common mistakes, and a second deal to solve on your own.
The answer at a glance
| Deal 1, bullet debt | Deal 1, cash sweep | Deal 2, your turn | |
|---|---|---|---|
| Purchase price | 9x $50m of EBITDA = $450m | 9x $50m of EBITDA = $450m | 10x $40m of EBITDA |
| Debt | $250m at 6%, repaid at exit | $250m at 6%, repaid every year with all free cash flow | 5x EBITDA at 7%, repaid at exit |
| Sponsor equity (equity check) | $200m | $200m | solve it below |
| Equity at exit, year 5 | $575.00m | $587.32m | solve it below |
| MOIC | 2.875x | ≈ 2.94x | solution further down |
| IRR | ≈ 23.5% | ≈ 24.0% | solution further down |
| Call vs. a 20% target IRR | invest | invest | the right answer is “I'd pass” |
The debt convention alone is worth $12.32m of exit equity and about half a point of IRR on the same deal. And the practice case is built so that a growing company is still a pass at the asking price. Both are explained step by step below.
What the interviewer is really testing
The math in a paper LBO is simple. The interviewer is really watching five things.
- Structure. You follow a fixed order, say it out loud before you start, and never need to go back. If you jump from the purchase price to the IRR without working through the debt, the first changed assumption will throw you.
- Comfort with numbers. You calculate cleanly, sanity-check orders of magnitude and own your rounding (“about 23.5%”).
- Understanding of the return drivers. You can say where the return comes from: EBITDA growth, a change in the multiple, debt paydown.
- Judgment. A MOIC without a recommendation is useless. Your last sentence is “I'd invest” or “I'd pass,” with the reason.
- Communication. You think out loud and state your conventions: bullet repayment or cash sweep, multiple applied to LTM EBITDA, no fees.
The 7-step method
Every paper LBO is solved in the same order. Learn it by heart.
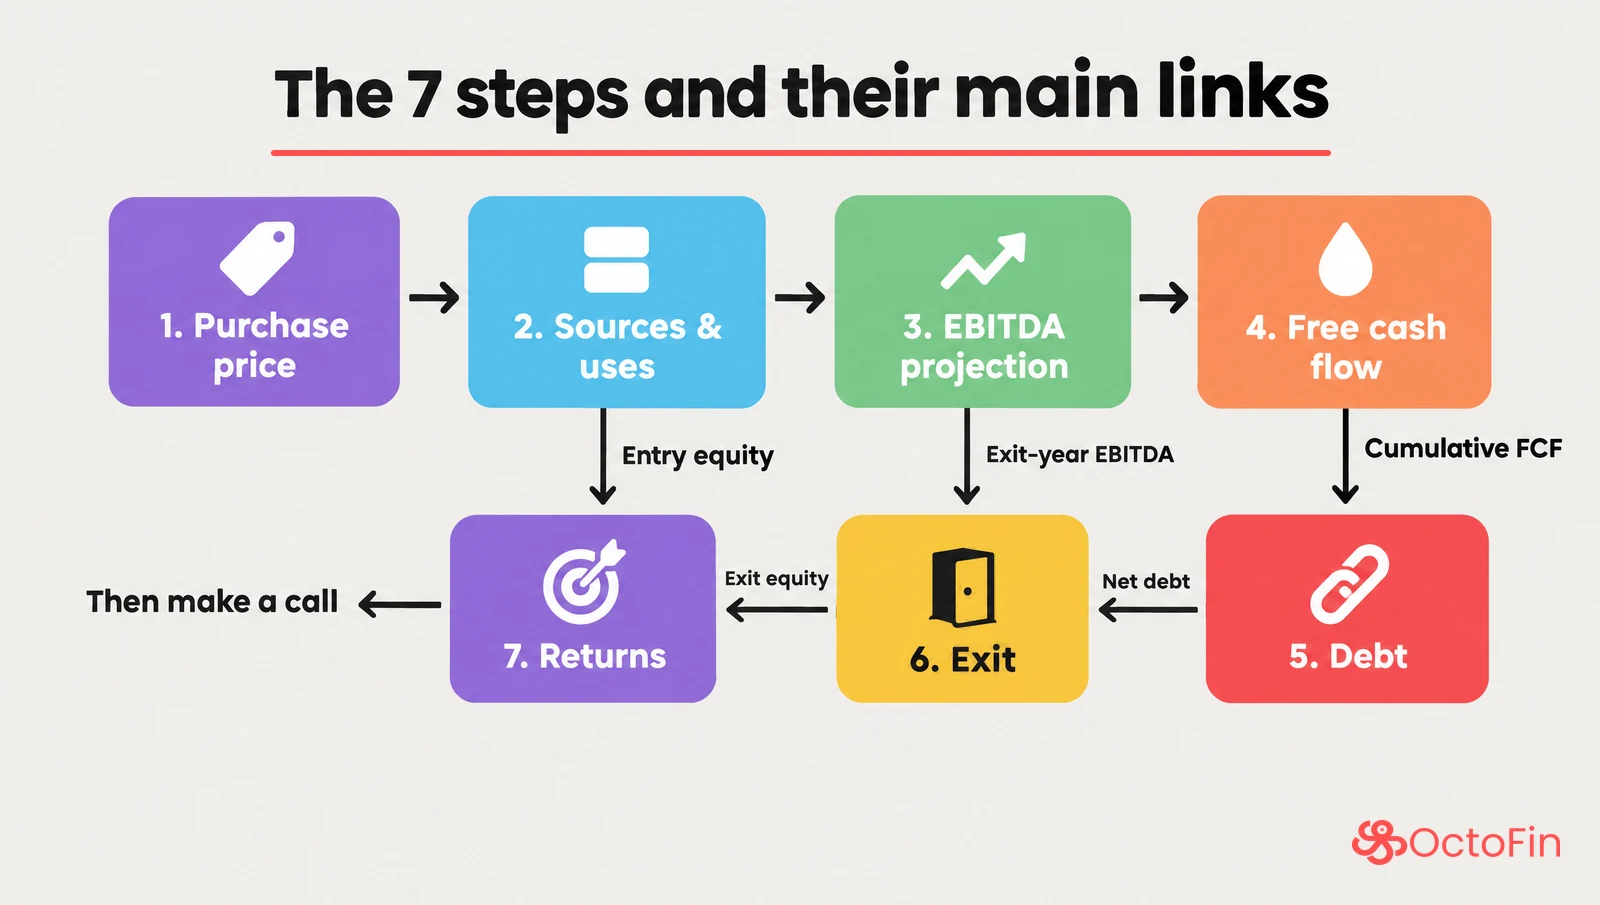
| Step | What you calculate | How |
|---|---|---|
| 1. Purchase price | Enterprise value (TEV) paid | Entry multiple × LTM EBITDA |
| 2. Sources & uses | Debt and sponsor equity | Debt = leverage multiple × EBITDA; equity = TEV + fees − debt |
| 3. EBITDA projection | EBITDA for each year until exit | Prior-year EBITDA + growth |
| 4. Free cash flow | Cash available to pay down debt | Net income + D&A − capex − increase in NWC |
| 5. Debt | Net debt at exit | Opening debt − cumulative FCF (bullet), or a year-by-year schedule (cash sweep) |
| 6. Exit | Equity value at exit | Exit multiple × exit-year EBITDA − net debt |
| 7. Returns | MOIC and IRR | MOIC = exit equity / entry equity; IRR = MOIC^(1/n) − 1 |
Net income = (EBITDA − D&A − interest) × (1 − tax rate). D&A is a non-cash expense, but it lowers taxes: that's why you subtract it before tax, then add it back to get to free cash flow.
There's an eighth step that isn't a calculation but is easy to forget: make a call. The fund has a target IRR; your number is above or below it, and you say what you'd do.
How a paper LBO differs from an Excel LBO model
The logic is the same; the level of detail isn't. An Excel model handles several debt tranches, fees, a cash sweep with interest on average debt, a detailed NWC schedule and sensitivity tables. A paper LBO keeps a single debt tranche, round numbers and simple conventions, so everything can be done in your head. If you can do a paper LBO, you understand what each block of the full model does.
Paper LBO example: a 9x buyout over 5 years
The prompt
A private equity fund is looking at buying a services business.
- LTM EBITDA: $50m.
- Purchase price: 9x LTM EBITDA.
- Debt: 5x LTM EBITDA, at a fixed 6% interest rate, with a bullet repayment (repaid in one go, at exit).
- EBITDA grows by $5m a year.
- D&A = capex = $10m a year.
- Net working capital (NWC) is flat.
- Tax rate: 25%.
- Exit after 5 years, at the same multiple as entry (9x LTM EBITDA).
- No fees; the deal is cash-free, debt-free.
The question: the fund's target IRR, or hurdle rate, is 20% over 5 years. Does it invest?
Why 25% tax? It's a round number close to the statutory rate US companies face: the federal corporate rate is 21%, and the average combined federal and state rate is 25.5% in 2026, according to the Tax Foundation. If your prompt gives another rate, the method doesn't change: only the 0.75 in the shortcuts below does.
Step 1: purchase price
Enterprise value = 9 × 50 = $450m.
“Cash-free, debt-free” means the seller keeps the cash and pays off the existing debt: the fund buys the business with neither. With no fees, $450m is exactly what the fund has to finance.
Step 2: sources & uses
Debt = 5 × 50 = $250m. Sponsor equity = 450 − 250 = $200m.
| Uses | $m | Sources | $m |
|---|---|---|---|
| Purchase of the company (TEV) | 450 | Debt (5x EBITDA, 6%) | 250 |
| Fees | 0 | Sponsor equity | 200 |
| Total | 450 | Total | 450 |
Debt funds 55.6% of the price, equity 44.4%. Remember the $200m: that's the fund's equity check, and every return number is measured against it.
Step 3: project EBITDA
EBITDA rises by $5m a year: 55, 60, 65, 70, then $75m in year 5. Growth in dollars rather than in percent is easy to handle in your head. If the prompt gives you a growth rate, round each year to a simple number and say so.
Step 4: from net income to free cash flow
Write out year 1 in full once, so you don't miss a line.
| Year 1 | $m |
|---|---|
| EBITDA | 55 |
| − D&A | −10 |
| = EBIT | 45 |
| − Interest (6% × 250) | −15 |
| = Pre-tax income | 30 |
| − Taxes (25%) | −7.5 |
| = Net income | 22.5 |
| + D&A | +10 |
| − Capex | −10 |
| − Increase in NWC | 0 |
| = FCF | 22.5 |
Then roll it forward over the 5 years ($m).
| Year | EBITDA | Interest | Net income | FCF |
|---|---|---|---|---|
| 1 | 55 | 15 | 22.5 | 22.5 |
| 2 | 60 | 15 | 26.25 | 26.25 |
| 3 | 65 | 15 | 30 | 30 |
| 4 | 70 | 15 | 33.75 | 33.75 |
| 5 | 75 | 15 | 37.5 | 37.5 |
| Total | 150 |
Here, D&A equals capex and NWC is flat, so FCF equals net income. And since D&A + interest = 10 + 15 = 25 every year, you get a mental-math shortcut: FCF = (EBITDA − 25) × 0.75. For year 3: (65 − 25) × 0.75 = 30.
If getting from EBITDA to FCF isn't automatic yet, our free accounting cheat sheet covers how the three financial statements link. The page previews it in English; the downloadable PDF is in French for now.
Step 5: debt
With a bullet repayment, debt stays at $250m until exit, and interest stays at $15m a year. Meanwhile, free cash flow builds up as cash: $150m after 5 years.
Net debt at exit = 250 − 150 = $100m.
That's the same as repaying $150m of debt on exit day. You ignore the interest that cash would earn in the meantime: it's a simplification, so say it.
Step 6: exit
| Exit (end of year 5) | $m |
|---|---|
| Year 5 EBITDA | 75 |
| × Exit multiple | 9x |
| = Enterprise value at exit | 675 |
| − Net debt (250 − 150) | −100 |
| = Equity value at exit | 575 |
The entry multiple was applied to LTM EBITDA, and so is the exit multiple. That's why you multiply year 5 EBITDA, not year 6.
Step 7: returns
MOIC (also called MoM, or the cash-on-cash multiple) = 575 / 200 = 2.875x.
IRR = 2.875^(1/5) − 1 ≈ 23.5%.
Without a calculator, use the table in “IRR without a calculator,” further down. Over 5 years, 2.5x gives 20.1% and 3.0x gives 24.6%. 2.875x sits three-quarters of the way between the two: 20.1 + 0.75 × (24.6 − 20.1) ≈ 23.5%.
Where the value comes from
The fund put in 200 and gets back 575: it created $375m of equity value. Break it down, and be ready for it as a follow-up.
| Driver | Calculation | $m | Share |
|---|---|---|---|
| EBITDA growth | (75 − 50) × 9 | 225 | 60% |
| Multiple change | (9 − 9) × 75 | 0 | 0% |
| Debt paydown | 250 − 100 | 150 | 40% |
| Total | 575 − 200 | 375 | 100% |
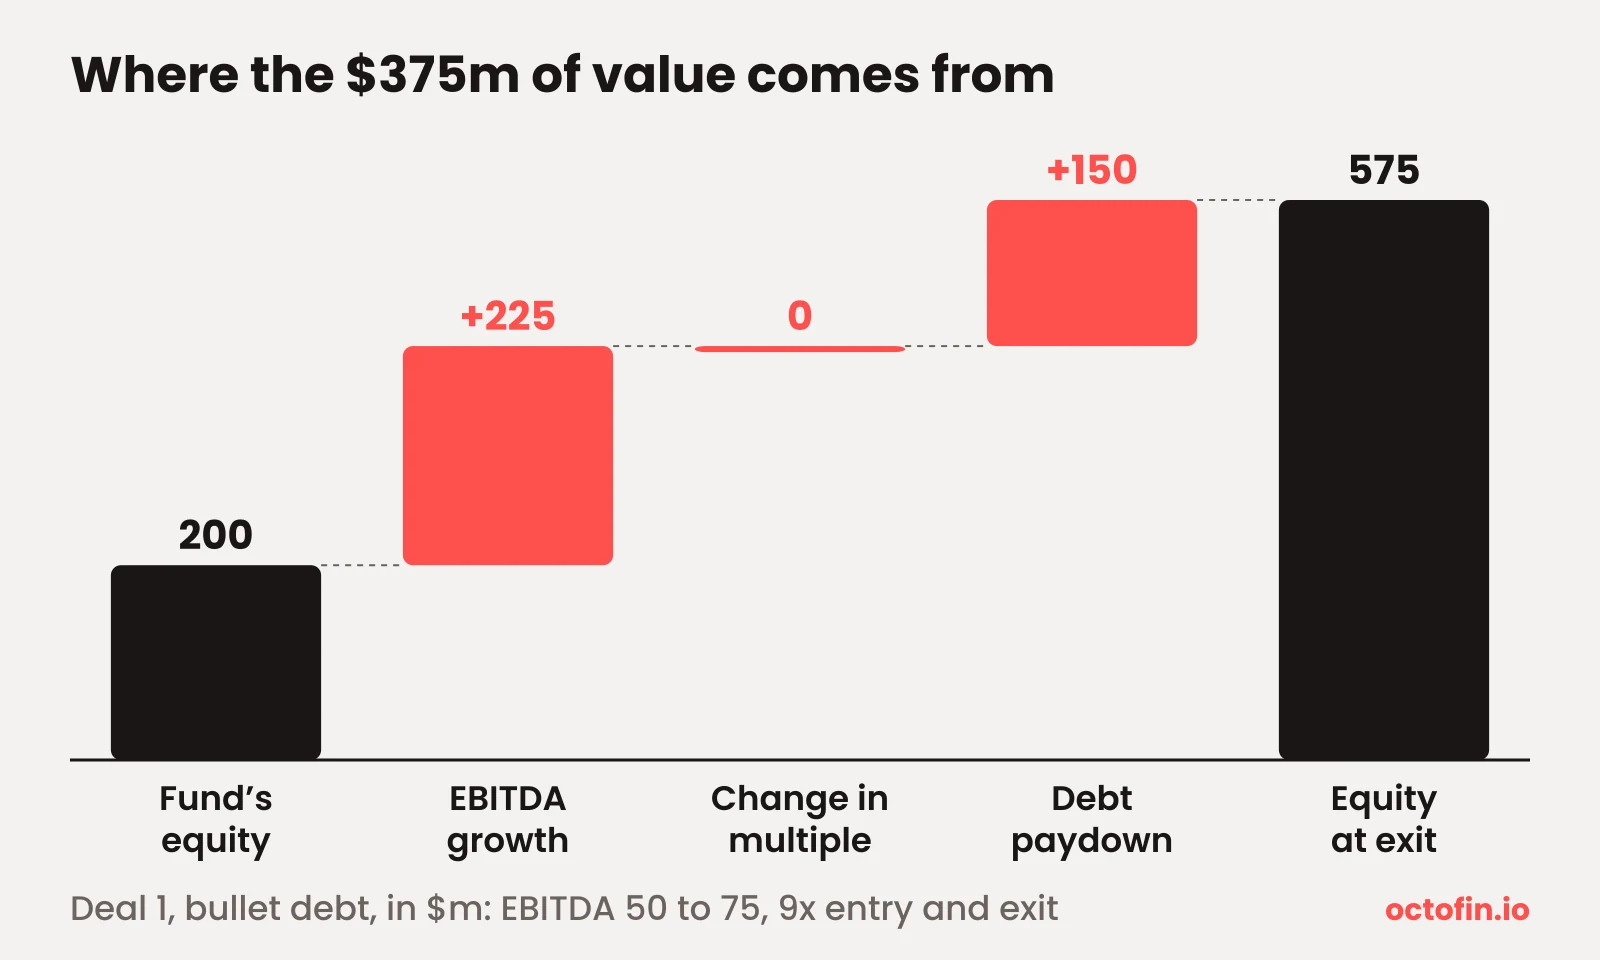
The three formulas to remember: EBITDA growth is valued at the entry multiple; the multiple change applies to exit EBITDA; debt paydown is the drop in net debt, which is cumulative FCF. The total must land exactly on the gain in equity: that's your check.
The call
A complete answer takes three sentences:
“At 2.875x and an IRR of about 23.5% over 5 years, the deal clears the 20% target, which is roughly 2.5x: I'd invest. The return doesn't depend on multiple expansion, since I exit at the entry multiple; 60% of the value creation comes from EBITDA growth, so the $5m-a-year growth plan is the first thing I'd diligence. The debt is manageable: in year 1, EBITDA already covers interest more than 3.5 times.”
The number isn't enough. Explaining the risks is what shows you think like an investor.
Same deal, second convention: cash sweep
In many LBOs, the debt doesn't wait for the exit: the cash the business generates pays it down along the way. That's a cash sweep. Every year, all free cash flow repays debt, and that year's interest is charged on the opening balance.
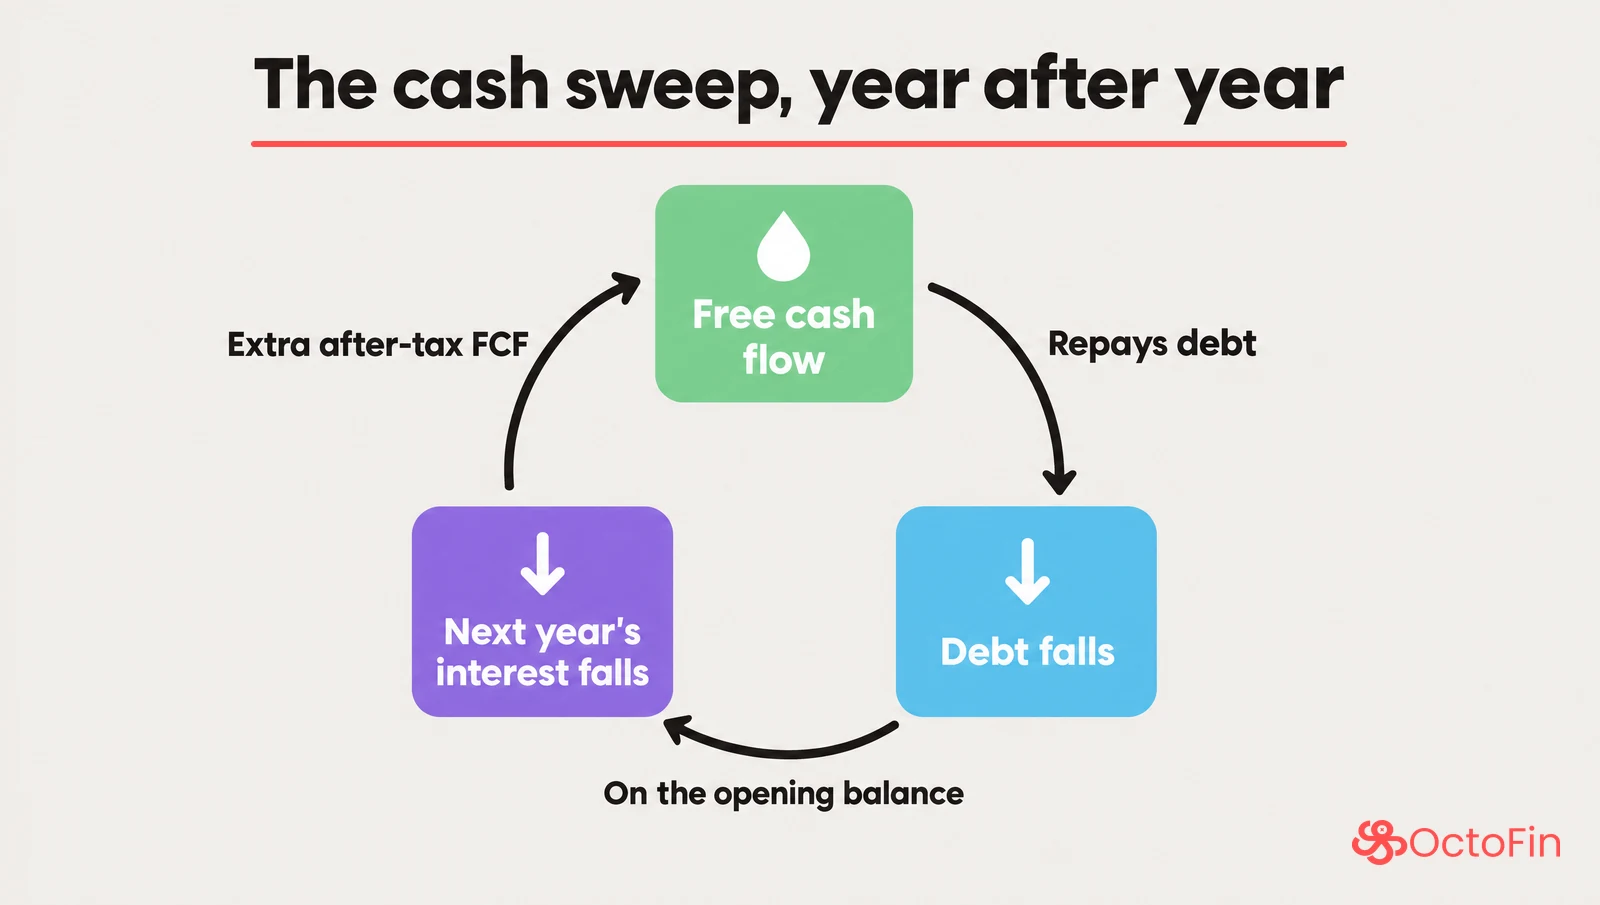
Year 1 doesn't change: interest of 6% × 250 = 15, FCF of 22.50, and debt of 250 − 22.50 = 227.50 at year-end.
In year 2, interest falls: 6% × 227.50 = 13.65. FCF becomes (60 − 10 − 13.65) × 0.75 ≈ 27.26, and debt drops to 227.50 − 27.26 = 200.24.
| Year | EBITDA | Interest | FCF | Debt at year-end |
|---|---|---|---|---|
| 1 | 55 | 15.00 | 22.50 | 227.50 |
| 2 | 60 | 13.65 | 27.26 | 200.24 |
| 3 | 65 | 12.01 | 32.24 | 168.00 |
| 4 | 70 | 10.08 | 37.44 | 130.56 |
| 5 | 75 | 7.83 | 42.87 | 87.68 |
Equity at exit: 675 − 87.68 = $587.32m. MOIC ≈ 2.94x, IRR ≈ 24.0%.
| Over 5 years ($m) | Bullet | Cash sweep |
|---|---|---|
| Cumulative interest | 75.00 | 58.58 |
| Cumulative FCF | 150.00 | 162.32 |
| Net debt at exit | 100.00 | 87.68 |
| Equity at exit | 575.00 | 587.32 |
| MOIC | 2.875x | ≈ 2.94x |
| IRR | ≈ 23.5% | ≈ 24.0% |
The cash sweep returns a bit more because interest falls every year. You can prove it in one line: 75.00 − 58.58 = 16.42 of interest saved, or 16.42 × 0.75 ≈ 12.32 of extra after-tax FCF. That's exactly the gap between 587.32 and 575.
Which one should you use in an interview? Without a calculator, a bullet repayment (or interest on the original debt, which gives the same result) is a reasonable simplification, as long as you say so. If you have a calculator and the time, the cash sweep shows you know how real LBO debt works. In an Excel model, interest is often calculated on the year's average debt, which creates a circular reference; on paper, interest on the opening balance avoids that problem.
Interviewer follow-ups
Once you've made your call, the interviewer changes one assumption and asks for the new result. Each follow-up tests one return driver. The reflex: only recalculate what moves, and build on what's already on your sheet. All answers below start from deal 1 with a bullet repayment ($m).
| Follow-up | What moves | Calculation | Answer |
|---|---|---|---|
| “What if you exit at 8x?” | Exit value | 8 × 75 = 600; 600 − 100 = 500; 500 / 200 | 2.5x, IRR ≈ 20.1% |
| “And at 10x?” | Exit value | 10 × 75 = 750; 750 − 100 = 650; 650 / 200 | 3.25x, IRR ≈ 26.6% |
| “What exit multiple gets you to 3x?” | You work backward | 3 × 200 = 600 of equity; 600 + 100 of net debt = 700; 700 / 75 | ≈ 9.3x |
| “What's the most you'd pay for a 20% IRR?” | You work backward | Exit held at 9x; 20% over 5 years ≈ 2.5x; 575 / 2.5 = 230 of equity; 230 + 250 of debt = 480; 480 / 50 | ≈ 9.6x |
| “What if EBITDA stays flat at 50?” | FCF and exit value | FCF = (50 − 25) × 0.75 = 18.75 a year, or 93.75; net debt 156.25; 9 × 50 = 450; 450 − 156.25 = 293.75 | ≈ 1.47x, IRR ≈ 8.0% |
| “What about 4x leverage instead of 5x?” | Sources & uses, interest, FCF | Debt 200, equity 250, interest 12; FCF = (EBITDA − 22) × 0.75, or 161.25 cumulative; net debt 38.75; 675 − 38.75 = 636.25 | 2.545x, IRR ≈ 20.5% |
| “What if you exit after 3 years?” | Holding period, exit EBITDA, debt | 9 × 65 = 585; cumulative FCF 78.75; net debt 171.25; 585 − 171.25 = 413.75 | ≈ 2.07x, IRR ≈ 27.4% |
What each follow-up should make you say:
- 8x and 10x: one turn of exit multiple is worth $75m of equity (1 × exit EBITDA), or 0.375x of MOIC. At 8x, the deal only just clears 20%: the margin of safety on the exit multiple is thin.
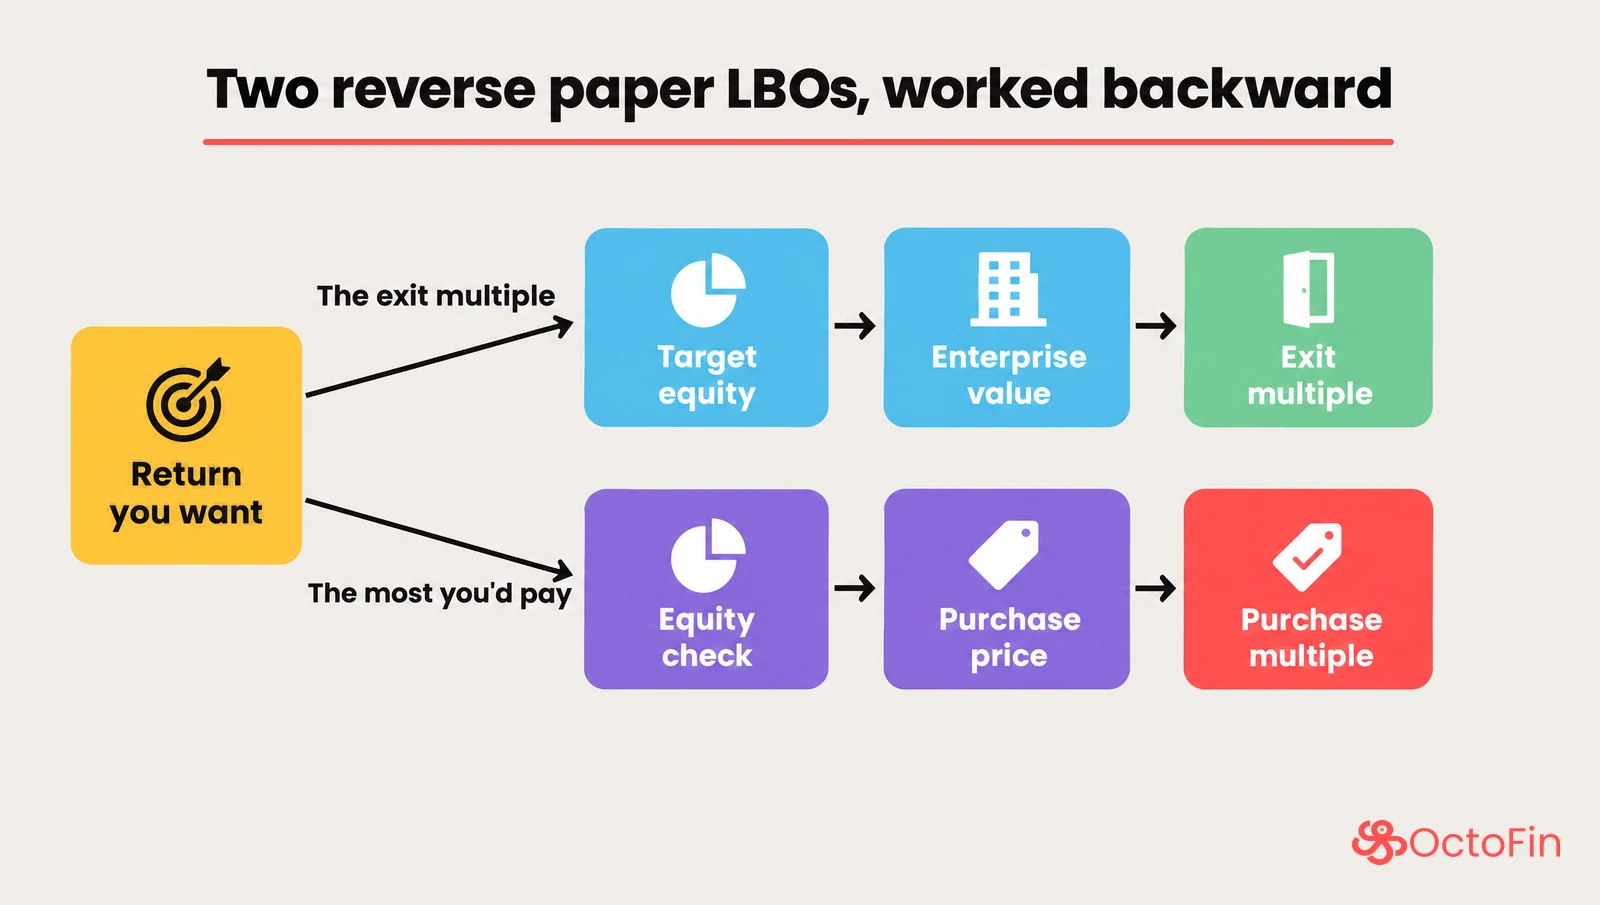
- The exit multiple for 3x: this is a reverse paper LBO. You start from the return you want and work back to the input: target equity, then enterprise value, then the multiple. 9.3x is barely above the 9x paid: the target is reachable without an aggressive bet on the exit.
- The most you'd pay: a second reverse paper LBO, this time solving for the purchase price. Keep the exit at 9x: the interviewer is asking what you'd pay, not what you'd sell for. Debt is set at 5x EBITDA, so it stays at $250m whatever the price, and so do interest, free cash flow and the $575m of exit equity. Only the equity check moves. At 9.6x, the fund pays $480m and puts in $230m: 575 / 230 = 2.5x, about 20%. With the exact target, 1.2^5 ≈ 2.488x, you get 9.62x: the same answer to one decimal. Above roughly 9.6x, you'd pass. If the exit multiple moves with the price (exit = entry), the answer becomes about 10.5x: state which convention you're using.
- Flat EBITDA: with no growth, IRR falls to about 8%. That confirms the value bridge: the deal rests on growth.
- Less debt: exit equity goes up (636.25 vs. 575), but the fund put in 250 instead of 200. MOIC and IRR go down: that's leverage, seen in reverse.
- 3-year exit: IRR rises (about 27.4% vs. 23.5%), but the fund gets back less money (413.75 vs. 575). IRR rewards speed; MOIC measures the wealth created. A fund looks at both.
IRR without a calculator
When there are no interim cash flows, IRR = MOIC^(1/n) − 1, where n is the number of years. Nobody takes a fifth root in their head: you memorize a table.
| MOIC | 3 years | 4 years | 5 years |
|---|---|---|---|
| 1.5x | 14.5% | 10.7% | 8.4% |
| 2.0x | 26.0% | 18.9% | 14.9% |
| 2.5x | 35.7% | 25.7% | 20.1% |
| 3.0x | 44.2% | 31.6% | 24.6% |
| 3.5x | 51.8% | 36.8% | 28.5% |
Four anchors cover most cases: 2x in 5 years, about 15%; 2.5x in 5 years, about 20%; 3x in 5 years, about 25%; 2x in 3 years, about 26%. Between two rows, interpolate, as with the 2.875x in deal 1.
The rule of 72, used correctly (and the rule of 115)
Here's what the rule of 72 actually says, and where it stops working.
- What it gives you: a doubling time. At r% a year, money doubles in about 72 / r years. At 8%, in about 9 years.
- In reverse: to double your money in n years, you need about 72 / n percent a year. A 2x in 5 years gives 72 / 5 ≈ 14.4%, against a true IRR of 14.9%.
- Its limit: it only gives you an IRR for a 2x. It doesn't apply to a 2.875x: dividing 72 by 5 tells you nothing about a multiple other than 2. For deal 1, use the table.
- Its accuracy: on 3- to 5-year holds, it understates IRR, and more so the shorter the hold. A 2x in 3 years gives 72 / 3 = 24%, while the true IRR is 26.0%.
- The rule of 115 works the same way for a 3x: money triples in about 115 / r years (about 11.5 years at 10%), so a 3x in n years needs about 115 / n percent a year. A 3x in 5 years gives 115 / 5 = 23%, against a true IRR of 24.6%; a 3x in 3 years gives about 38.3%, against 44.2%. Same limit (it only works for a 3x), same downward bias.
Common mistakes
Calculating returns on enterprise value
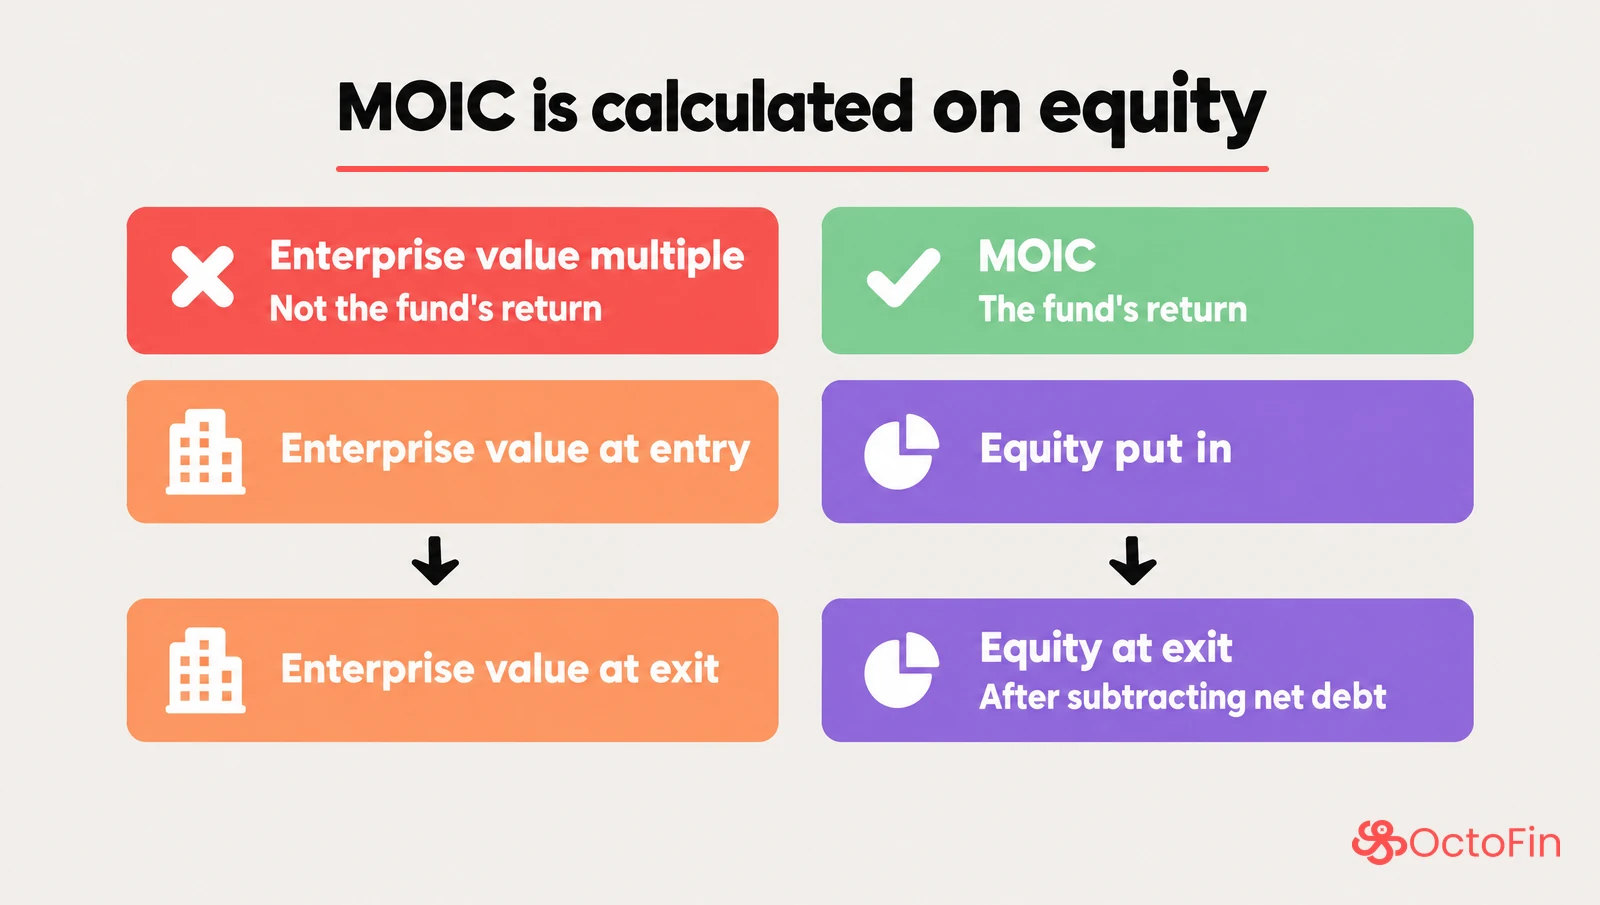
675 / 450 = 1.5x is the enterprise value multiple, not the fund's return. The fund put in 200, not 450, and gets back 575, not 675. MOIC is always calculated on equity, after subtracting net debt.
Forgetting taxes or interest
Without taxes, cumulative FCF rises to 200 instead of 150, and you announce 3.125x instead of 2.875x: 0.25x of MOIC too much. Interest reduces pre-tax income; tax applies after it. Always write out year 1 in full.
Using a forward multiple without projecting one more year
If the prompt says “exit at 9x next year's EBITDA” (a forward, or NTM, multiple), you need to project year 6: $80m, for an exit value of 720 and a MOIC of 3.1x. Conversely, applying an LTM multiple to year 6 EBITDA inflates the result. If the prompt doesn't say, ask, or state your convention.
Forgetting the change in NWC
An increase in NWC uses cash: every $1m increase in NWC is $1m less free cash flow, with no effect on net income. In deal 1, NWC is flat; it won't always be.
Stretching the rule of 72
“72 / 5 = 14.4%, so my IRR is 14.4%” is only right if the MOIC is 2x. For any other multiple, use the table.
Forgetting to make a call
A 23.5% IRR is not an answer. “I'd invest, because…” is. Always finish with a decision and the main risk.
Not stating your conventions
Bullet or cash sweep, interest on the original or the outstanding debt, LTM or forward multiple: none of them is wrong if you state it. All of them become wrong if the interviewer has to guess which one you used.
Deal 2: a paper LBO to solve on your own
This is your paper LBO practice case. Take a sheet of paper, no calculator, and give yourself 15 minutes. Every table on this page is plain text, so you can also print the page from your browser and work through it on paper.
The prompt
- LTM EBITDA: $40m.
- Purchase price: 10x LTM EBITDA.
- Debt: 5x LTM EBITDA, at a fixed 7%, with a bullet repayment.
- EBITDA grows by $2m a year.
- D&A = capex = $8m a year.
- NWC increases by $2m a year.
- Tax rate: 25%.
- Exit after 5 years, at 8x LTM EBITDA.
- No fees; the deal is cash-free, debt-free.
The questions: What's the MOIC? The IRR? Where does the value creation come from (or not)? The fund targets a 20% IRR: do you invest?
Copy this grid onto your sheet.
| Year | EBITDA | Interest | Net income | FCF |
|---|---|---|---|---|
| 1 | … | … | … | … |
| 2 | … | … | … | … |
| 3 | … | … | … | … |
| 4 | … | … | … | … |
| 5 | … | … | … | … |
| Total | … |
The solution is further down, under “Deal 2 solution.” Stop here while you work on it. One hint if you get stuck: compare the exit multiple with the entry multiple before you make your call.
Deal 2 solution
Done? Here's the solution, in the same order as deal 1.
Purchase price and sources & uses
Enterprise value = 10 × 40 = $400m. Debt = 5 × 40 = $200m. Sponsor equity = 400 − 200 = $200m. Annual interest = 7% × 200 = $14m.
Free cash flow
Year 1 in full: EBITDA 42; − D&A 8 = EBIT 34; − interest 14 = pre-tax income 20; − taxes 5 = net income 15; + D&A 8 − capex 8 − increase in NWC 2 = FCF 13.
| Year | EBITDA | Interest | Net income | FCF |
|---|---|---|---|---|
| 1 | 42 | 14 | 15 | 13 |
| 2 | 44 | 14 | 16.5 | 14.5 |
| 3 | 46 | 14 | 18 | 16 |
| 4 | 48 | 14 | 19.5 | 17.5 |
| 5 | 50 | 14 | 21 | 19 |
| Total | 80 |
The mental-math shortcut changes: D&A + interest = 22, so FCF = (EBITDA − 22) × 0.75 − 2. This time, FCF is lower than net income, because of the NWC build.
Exit and returns
Exit value = 8 × 50 = $400m. Net debt = 200 − 80 = $120m. Equity at exit = 400 − 120 = $280m.
MOIC = 280 / 200 = 1.4x. IRR ≈ 7.0%. With the table, you can place it without calculating: 1.5x over 5 years gives 8.4%, so 1.4x is below that.
If you forgot NWC, you got 90 of cumulative FCF and 1.45x. The call doesn't change, but the interviewer will notice.
Value creation
| Driver | Calculation | $m |
|---|---|---|
| EBITDA growth | (50 − 40) × 10 | +100 |
| Multiple change | (8 − 10) × 50 | −100 |
| Debt paydown | 200 − 120 | +80 |
| Total | 280 − 200 | +80 |
The multiple contraction wipes out all of the EBITDA growth. Only debt paydown is left, and it's small, because interest ($14m a year) eats into net income and the NWC build uses $2m of cash a year.
The call: I'd pass
Even with an exit at the entry multiple (10x), the deal only reaches 1.9x, an IRR of about 13.7%, well short of the target. To get to 2.5x (about 20%), you'd need to exit at 12.4x: (2.5 × 200 + 120) / 50. In other words, pay 10x and hope to sell for even more, for a business that only grows $2m a year. That's a bet an investment committee will find hard to accept.
“The deal returns 1.4x and about a 7% IRR: I'd pass at this price. EBITDA growth creates $100m of value, but the multiple contraction from 10x to 8x destroys just as much. Even with no contraction, we'd only get to 1.9x. To hit 20% with an 8x exit, I'd pay at most 7.8x EBITDA.”
That last number is a reverse paper LBO. Debt stays at 200 and net debt at exit at 120, so exit equity stays at 280. To make 2.5x, the fund can put in at most 280 / 2.5 = 112 of equity. Maximum enterprise value: 112 + 200 = 312, or 312 / 40 = 7.8x.
Saying no, with the numbers to back it up, and naming a price: that's what deal 2 tests. In an interview, the right answer isn't always “I'd invest.”
Frequently asked questions
What is a paper LBO?
A paper LBO is a leveraged buyout case you solve by hand, on a sheet of paper, without Excel. The interviewer gives you a few round assumptions (EBITDA, entry multiple, debt, growth, holding period, exit multiple), and you calculate the fund's return, MOIC and IRR, before saying whether you'd invest. It's a common exercise in private equity interviews.
Can you provide a simple example of a paper LBO?
Yes: deal 1 above. A company with $50m of LTM EBITDA is bought at 9x ($450m), funded with $250m of debt (5x EBITDA, 6%, bullet repayment) and $200m of sponsor equity. EBITDA grows $5m a year to $75m, and $150m of cumulative free cash flow brings net debt down to $100m. At a 9x exit, enterprise value is $675m and equity is $575m: 2.875x, an IRR of about 23.5% over 5 years. That beats a 20% target, so you'd invest.
Are paper LBOs hard?
The math is simple: multiplication, addition, and a root you read off a table. The hard part is elsewhere: keeping a structure under pressure, going fast, handling follow-ups without redoing everything, and making a call. With the 7-step method and the IRR table, it gets more natural with repetition. If the basics are still shaky, start with The world of finance, our free 4-page summary with an overview diagram and a glossary; the PDF is only available in French for now.
How long does a paper LBO take in an interview?
There's no standard length. As an order of magnitude, Wall Street Prep puts it at 5 to 10 minutes with pen and paper to get to the IRR and MOIC; Breaking Into Wall Street describes a time limit that's often 30 minutes or less. Follow-ups come on top. The format varies too: on paper, sometimes entirely out loud, and almost never with a calculator. Practice without one.
What is the rule of 72 in a paper LBO?
It's a doubling shortcut: at r% a year, money doubles in about 72 / r years, so a 2x in n years implies an IRR of about 72 / n percent. A 2x in 5 years gives 14.4%, when the true IRR is 14.9%. Its limit: it only works for a 2x, and on 3- to 5-year holds it understates the IRR. For a 3x, use the rule of 115 (115 / 5 = 23% for a 3x in 5 years, against 24.6% exactly). For anything else, such as the 2.875x in deal 1, use an IRR table.
What makes an attractive LBO candidate?
A business that can carry debt and pay it down: stable, predictable cash flows, limited capex and working capital needs, a solid market position, and a credible plan to grow EBITDA. The price matters as much as the business: deal 2 shows a growing company that is still a pass at 10x, because it's expected to exit at a lower multiple than it was bought at. And there has to be a realistic way out, such as a sale to a strategic buyer, a sale to another fund or an IPO.
Keep practicing
A paper LBO gets easier the more you redo it with changing assumptions. In OctoFin, LBOs are part of the 11 lesson chapters, and Practice builds your next session around your success rate, chapter by chapter. To see what's on offer, head to the home page: view pricing. A mock interview with a professional is a different matter: OctoFin doesn't run those, so look for a human coach.